Tutorial: Area-Sum Template
This tutorial shows how you can use the area sum template to measure the wall areas of buildings. The area calculation takes the wall areas and subtracts the window and door areas. These area computations are then exported as data tables that you can include into the PDF output or that you can import into your spreadsheet program.
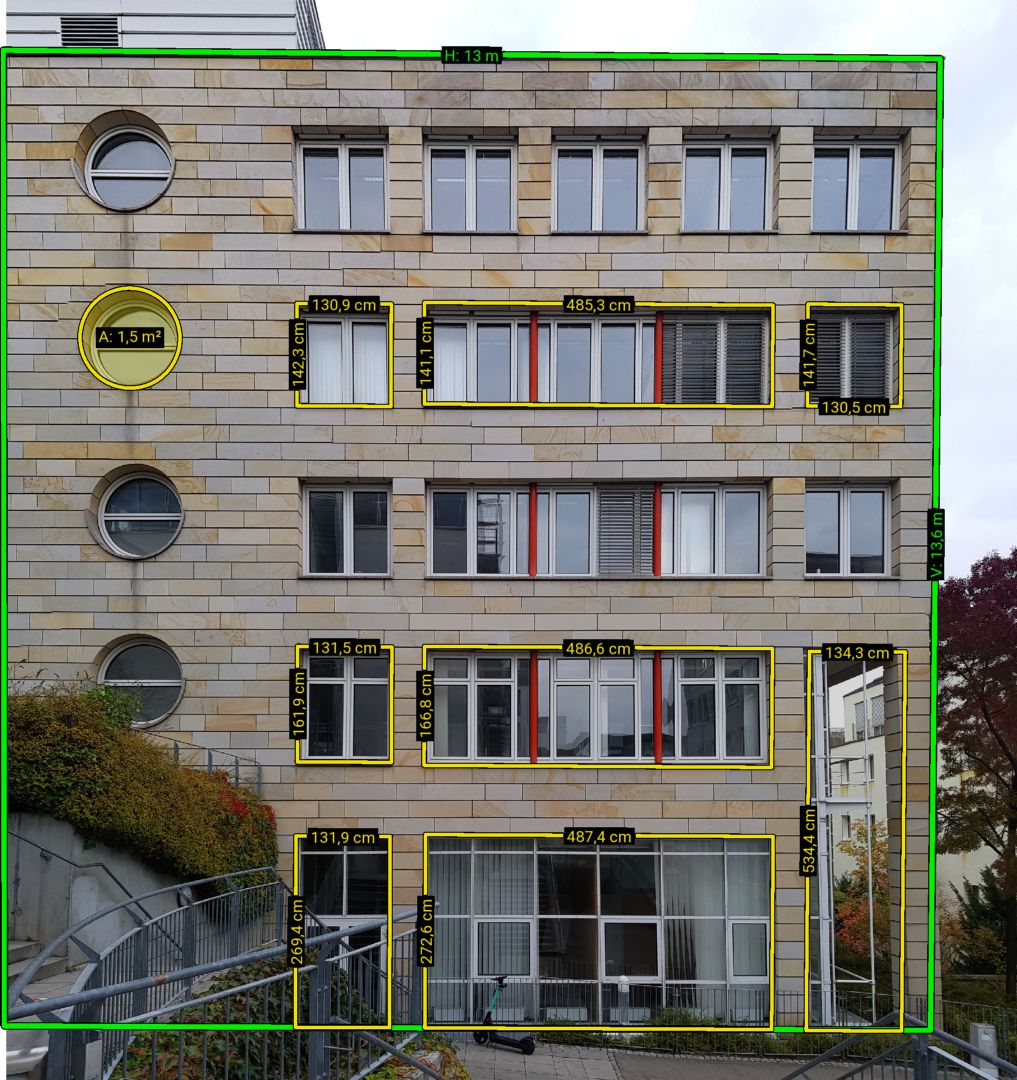
As ImageMeter has to know which of the areas that you marked in the image are walls that should be added, and which areas are holes, windows, or doors, you assign a tag to each element. Based on these tags, the software knows whether to add or to subtract the area of this element.
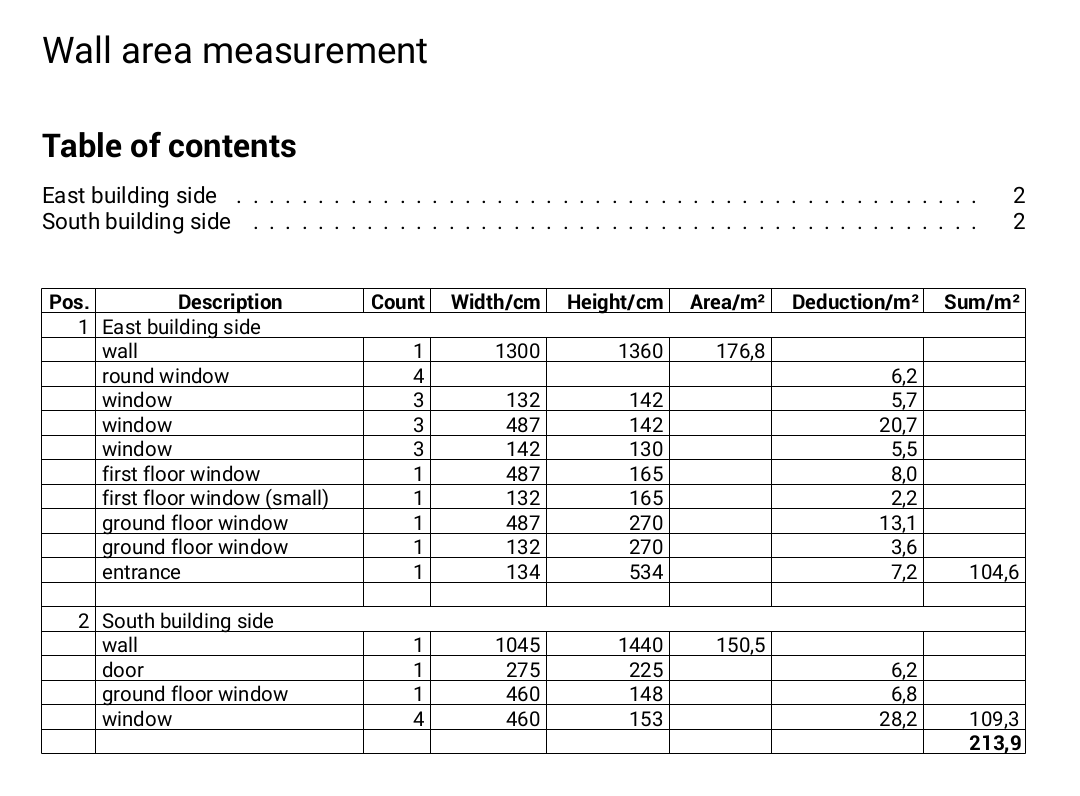
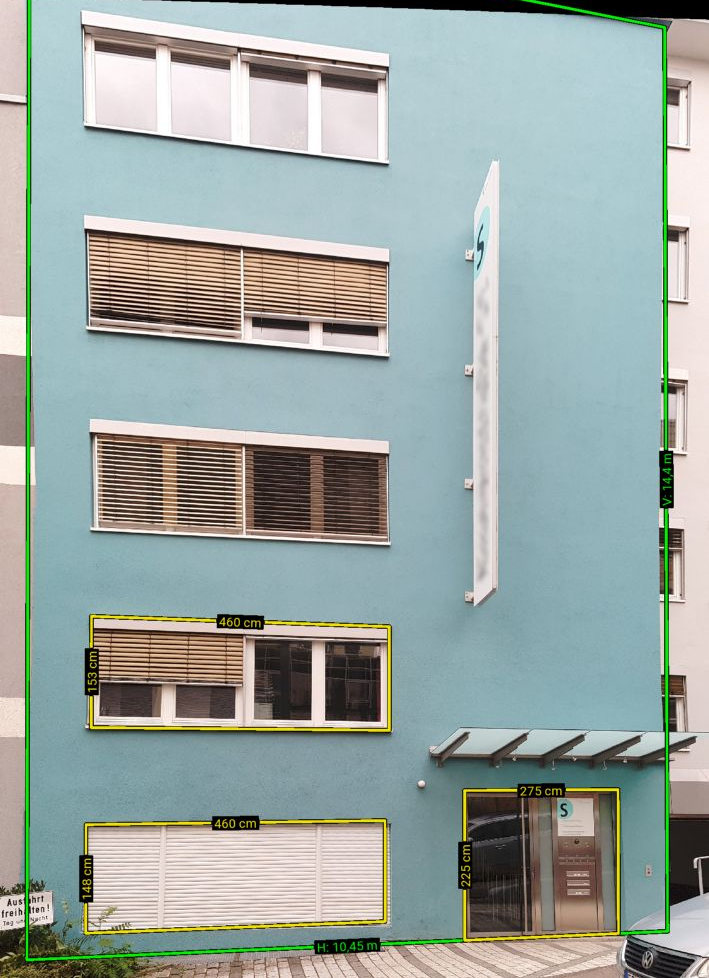
The following shows an example table generated from two photos. The exported CSV file containing this table can be downloaded from here.
Tutorial
Creating a new template
Before we can start using templates, we first have to create a template for our task. To keep things simple, we will start with using the predefined wall-area template. This is a predefined template, but we still have to add it to our set of templates that we can choose from.
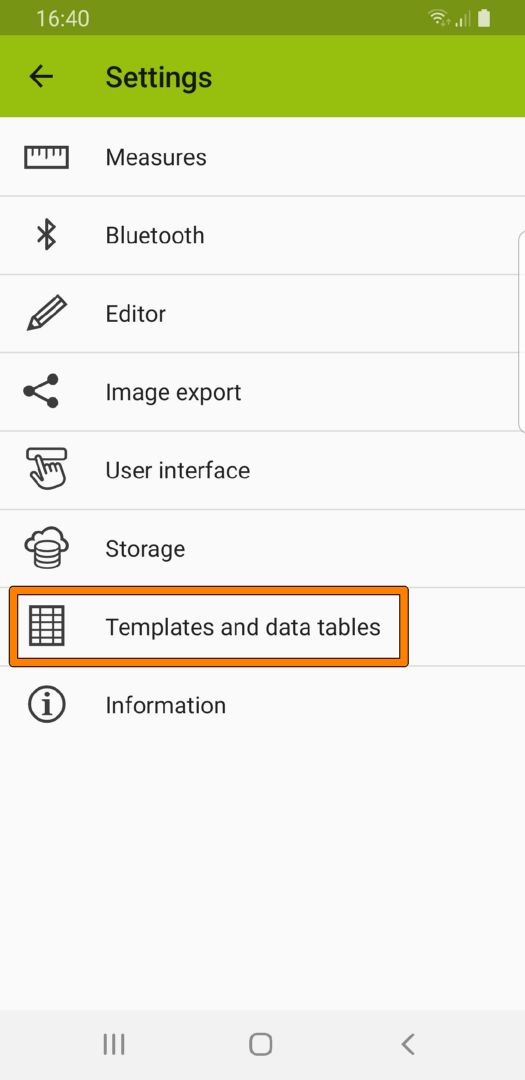
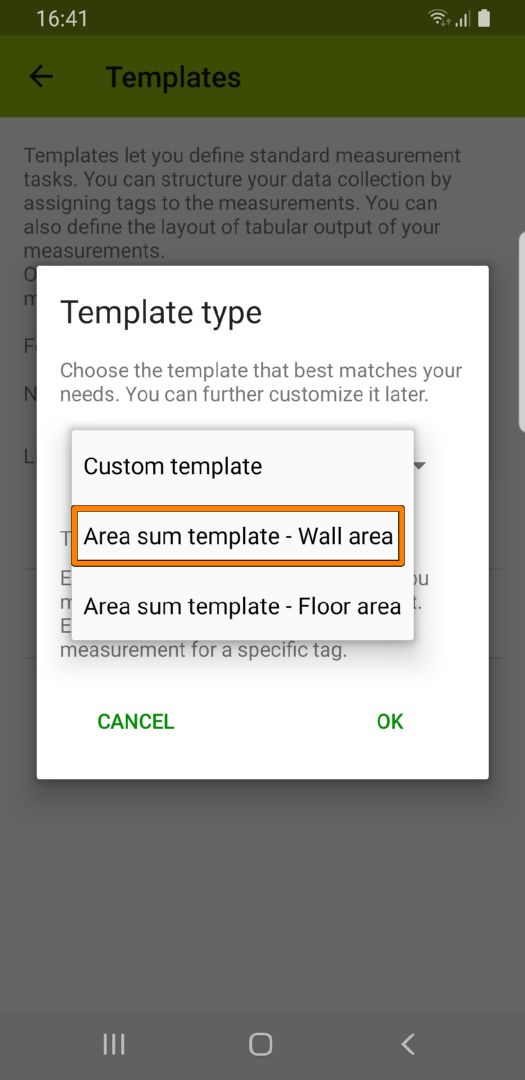
In order to do this, open the ImageMeter settings and enter the section Templates and data tables (Fig. 1). The list of templates is still empty. Press '+ add template' to add a new one. You may choose between several template types. We will use the 'Area sum template - Wall area' here (see Fig. 2). Each of these templates can be customized to your needs later, but there are also a few presets here that get you started quickly. Below the template selection, you see a short description what this type of template can be used for.
The purpose of the 'Area sum template - Wall area' is to compute a sum of areas (e.g. walls), with subtraction of some hole areas (e.g. windows, doors). This can be used, for example, for computing the amount of paint needed for a building. There is also a 'Area sum template - Floor area'; this is the same template type, just with different predefined tags.
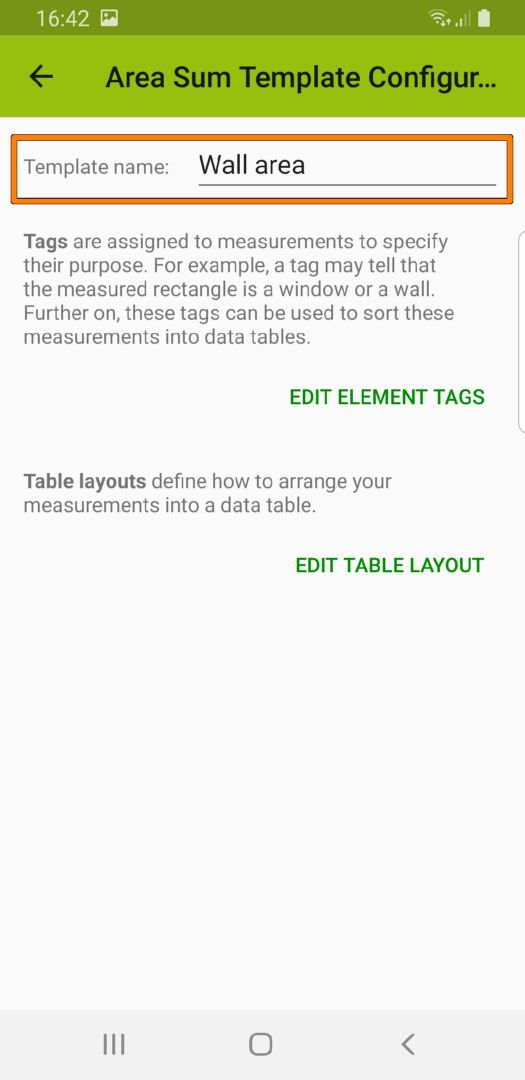
After you selected your template, it is added to the list and you can rename it to a more suitable name (Fig. 3). We are not going to customize the template further for now, so just close the settings.
We are ready to go.
Measuring images with templates
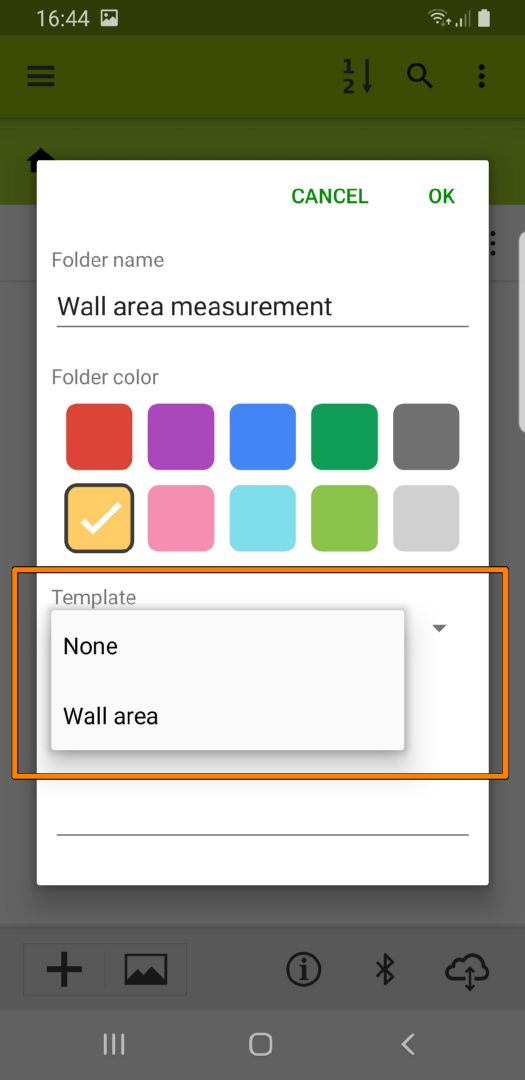
Let us start by creating a new folder for all images that should be included into the table. This is not absolutely necessary, but usually, you will want to include more than one image in the table and having a folder makes it more clear. Add a new folder and open the rename dialog (if it does not open automatically). In this dialog, there is an option that lets you choose a template (see Fig. 4). The template does not have a direct effect on the folder, when assigned to a folder, a template will also be automatically assigned to every new image created in this folder.
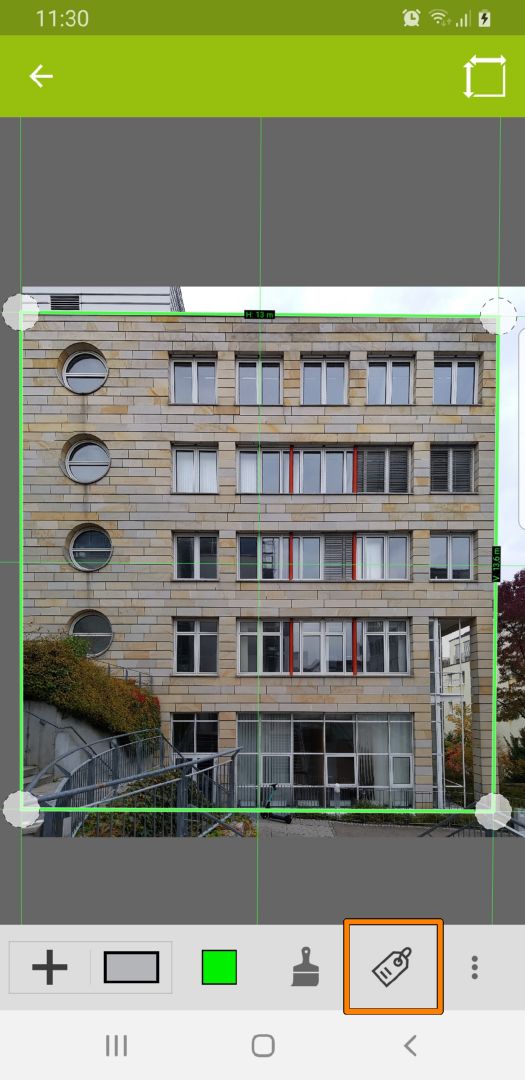
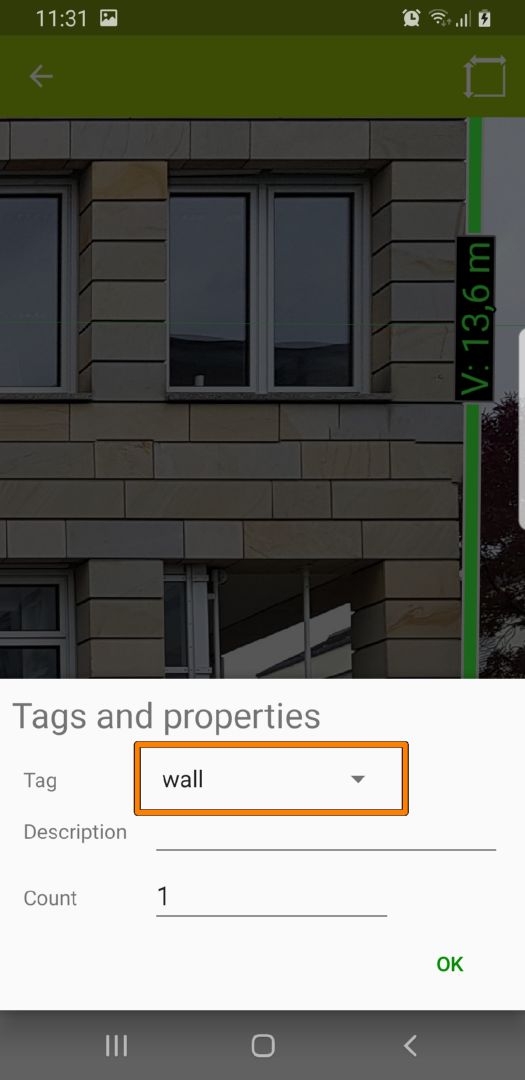
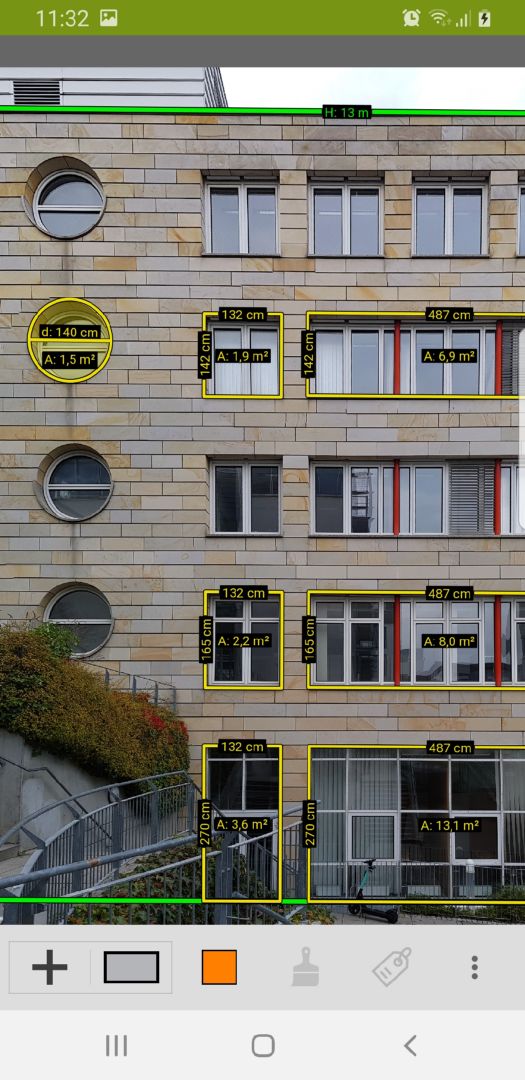
Now add the photos of the walls you want to measure. We start the measuring by marking the total wall size with the Perspective reference rectangle. We could also use a normal rectangle or the area tool, but using the Perspective reference has the advantage that the sizes of the windows and doors on the wall will be calculated automatically. In order to specify what we have just measured, use the tag icon in the toolbar (see Figs. 5 and 6). This will show a dialog with parameters for this element. Which parameters are shown here depend on the template you have chosen. In any case, there will be a tag choice which you can use to assign the appropriate tag to the drawn element. We set the tag to: wall.
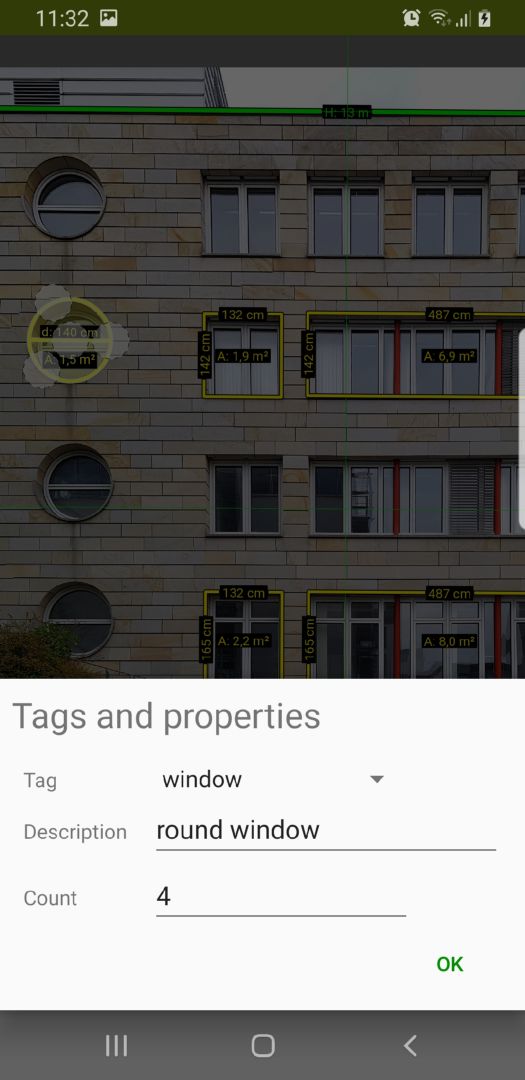
After adding the wall, we are going to add the windows that have to be subtracted from the total area. This time, we are going to use the rectangle tool and the circle tool for the round windows (see Fig. 7). Each of them receives a window tag like we did before (Fig. 8).
Note that there are several windows with the same size. We do not have to mark all of these individually, but can instead simply mark one of them and set a Count value. If we want, we can also add an optional Description text. In case this is left empty, the tag name is used as description.
That is all we have to do when measuring the objects in an image.
Exporting data tables
When you have annotated your images with the template tags, you can generate data tables from the images. These can be included in an output PDF or as CSV data.
Exporting is very easy:
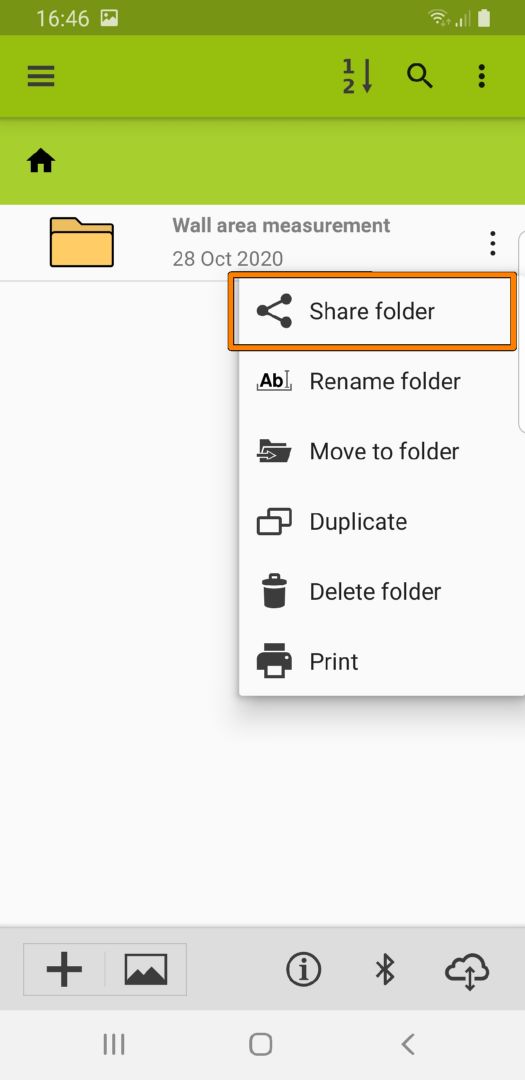
- Choose Share for the folder containing the photos (Fig. 9). Alternatively, you can also select a subset of photos manually.
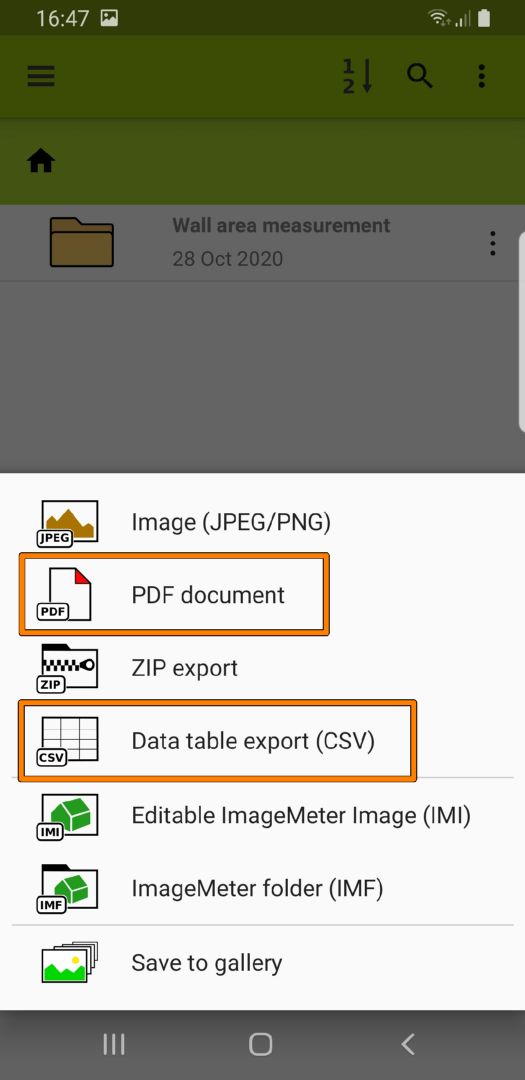
- Select the output format (PDF or CSV).
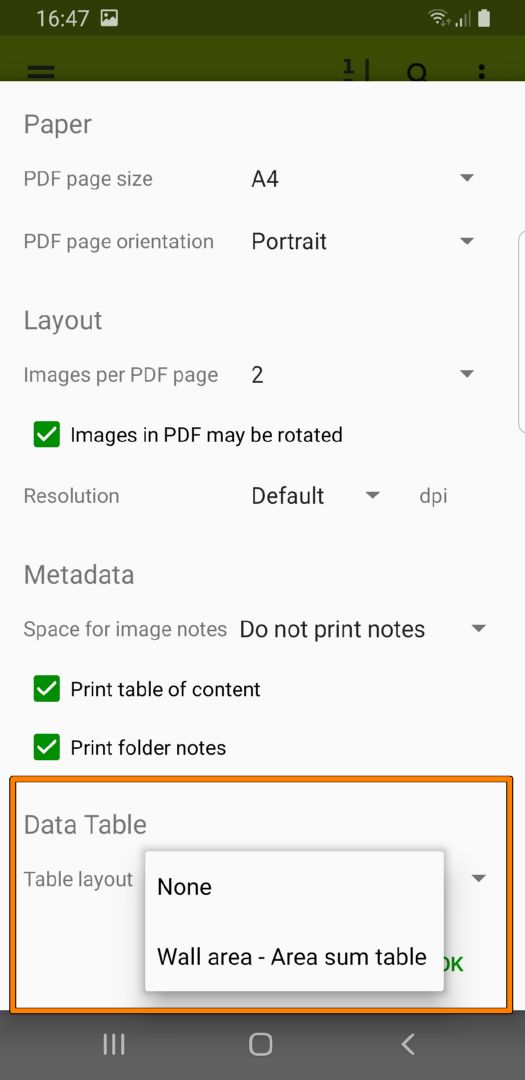
- Choose which table layout should be used for the output.
The output of the export will give you tables as shown at the top of this page.